How to Reduce Telemetry Data Produced by Your App
In previous articles, we discussed how to connect your application to Grafana using OpenTelemetry:
While observability and monitoring are crucial throughout the lifecycle of a production application, budget constraints at the beginning of a project often prevent us from affording additional costs for monitoring tool subscriptions. In such cases, focusing on storing only essential data is vital. Fortunately, Grafana Cloud offers a free plan for small teams. However, when sending all telemetry data gathered by OpenTelemetry auto-instrumentation, we can quickly reach the free tier limit, especially with metrics.
So what can we do about it?
In this article, we will discuss several methods to reduce the amount of telemetry data produced by your application.
Identify unnecessary metrics
The first step is to review all metrics produced by your application and determine if you are using them (or plan to use them in the future).
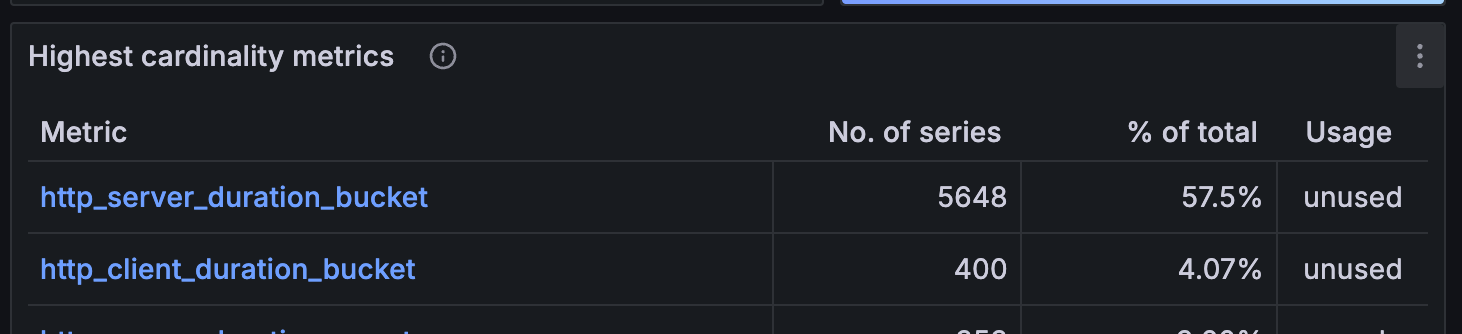
Grafana provides a tool called Cardinality Management to review metrics production. It can be found at {myaccount}.grafana.net -> Home -> Dashboards -> GrafanaCloud -> Cardinality Management - 1 - Overview.

For example, in Java auto-instrumentation for Spring Boot applications, we have two very similar metrics:
http.server.requestshttp.server.request.duration
The first metric is provided by Spring Boot, and the second one by OpenTelemetry. There is no reason to keep both since they essentially provide the same information. I decided to keep the one provided by OpenTelemetry and drop the other using the filter processor in my opentelemetry-collector-contrib:
 metrics:
   exclude:
     match_type: strict
     metric_names:
       - http.server.requests
Identify unnecessary labels
If you need to retain the rest of your metrics but their series count is too high, Grafana suggests removing some labels to reduce cardinality. The second part of the Cardinality Management dashboard lists the “Top labels by value count”.
In my case, the biggest issue was with the http.server.duration (later changed to http.server.request.duration) metric. To keep only essential labels, you can aggregate labels using the metricstransform processor:
metricstransform/aggregate_http_server_request_duration_labels:
 transforms:
   - include: http.server.request.duration
     action: update
     operations:
       - action: aggregate_labels
         label_set: [ deploy.environment, service.name, http.method, http.status_code, http.route, instance, user_agent.original ]
         aggregation_type: sum
Histogram view customization
Even after aggregating the labels, the http.server.request.duration metric continued to produce an excessive number of active series, primarily due to the buckets used for grouping request duration times.
We used a custom view for HTTP metrics histograms to set our custom bucket boundaries.
We added the file metrics_view_config.yaml:
- selector:
    instrument_type: HISTOGRAM
    instrument_name: http.*
  view:
    aggregation: explicit_bucket_histogram
    aggregation_args:
      bucket_boundaries: [0.05, 0.25, 1.0]
And set the environment variable:
OTEL_EXPERIMENTAL_METRICS_VIEW_CONFIG=opentelemetry/metrics_view_config.yaml
For JavaScript/TypeScript instrumentation, the custom boundaries may be set in NodeSDK:
const sdk = new opentelemetry.NodeSDK({
   traceExporter: traceExporter,
   metricReader: metricReader,
   views: [
       new View({
           aggregation: new ExplicitBucketHistogramAggregation([50, 250, 1000]),
           instrumentType: 'HISTOGRAM',
           instrumentName: 'http.*'
       })],
   sampler: sampler,
   resource: resource,
})
Reduce the number of traces
Even before your application’s traffic becomes significant, it may produce many traces. To reduce the number of traces sent to storage, you can apply the tail_sampling processor:
tail_sampling:
 decision_wait: 10s
 num_traces: 100
 policies:
   [
     {
       name: errors-policy,
       type: status_code,
       status_code: { status_codes: [ ERROR ] },
     },
     {
       name: minimal_latency_policy,
       type: latency,
       latency: { threshold_ms: 200 }
     },
     {
       name: randomized-policy,
       type: probabilistic,
       probabilistic: { sampling_percentage: 5 },
     }
   ]
Policy Analysis:
errors-policy: Retains traces where the status code indicates an error, ensuring error traces are always sampled for further analysis.
minimal_latency_policy: Retains traces where the latency is below 200 milliseconds, capturing minimal latency traces for performance optimization.
randomized-policy: Retains a random sample of 5% of all traces, providing a general overview of the system's performance and behavior.
The tail_sampling processor evaluates traces based on these three policies, capturing all error traces, traces with minimal latency, and a random 5% of all traces. It waits 10 seconds to gather complete trace data and processes up to 100 traces at a time.
Full Example of collector-config.yml:
extensions:
 basicauth/grafana_cloud_tempo:
   client_auth:
     username: "${TEMPO_USER}"
     password: "${TEMPO_PASSWORD}"
 basicauth/grafana_cloud_prometheus:
   client_auth:
     username: "${PROM_USER}"
     password: "${PROM_PASSWORD}"
 basicauth/grafana_cloud_loki:
   client_auth:
     username: "${LOKI_USER}"
     password: "${LOKI_PASSWORD}"
 health_check:
   endpoint: 0.0.0.0:${HEALTHCHECK_PORT}
receivers:
 otlp:
   protocols:
     http:
       endpoint: 0.0.0.0:${HTTP_PORT}

processors:
 batch:
 tail_sampling:
   decision_wait: 10s
   num_traces: 100
   policies:
     [
       {
         name: errors-policy,
         type: status_code,
         status_code: { status_codes: [ ERROR ] },
       },
       {
         name: minimal_latency_policy,
         type: latency,
         latency: { threshold_ms: 200 }
       },
       {
         name: randomized-policy,
         type: probabilistic,
         probabilistic: { sampling_percentage: 5 },
       }
     ]

 resource/loki-labels:
   attributes:
     - action: insert
       key: loki.resource.labels
       value: service.name, deploy.environment

 filter/drop_springboot_metrics:
   metrics:
     exclude:
       match_type: strict
       metric_names:
         - http.server.requests

 transform/add_resource_attributes_as_metric_attributes:
   error_mode: ignore
   metric_statements:
     - context: datapoint
       statements:
         - set(attributes["deploy.environment"], resource.attributes["deploy.environment"])
         - set(attributes["service.name"], resource.attributes["service.name"])
         - set(attributes["instance"], resource.attributes["instance"])
 metricstransform/aggregate_http_server_request_duration_labels:
   transforms:
     - include: http.server.request.duration
       action: update
       operations:
         - action: aggregate_labels
           label_set: [ deploy.environment, service.name, http.method, http.status_code, http.route, instance, user_agent.original ]
           aggregation_type: sum
     - include: http.server.duration # old metric name from java-agent-1.27.0
       action: update
       operations:
         - action: aggregate_labels
           label_set: [ deploy.environment, service.name, http.method, http.status_code, http.route, instance, user_agent.original ]
           aggregation_type: sum

exporters:
 otlp/grafana_cloud_traces:
   endpoint: "${TEMPO_ENDPOINT}"
   auth:
     authenticator: basicauth/grafana_cloud_tempo

 prometheusremotewrite/grafana_cloud_metrics:
   endpoint: "${PROM_ENDPOINT}"
   add_metric_suffixes: false
   auth:
     authenticator: basicauth/grafana_cloud_prometheus

 loki/grafana_cloud_logs:
   endpoint: "${LOKI_ENDPOINT}"
   default_labels_enabled:
     job: true
     exporter: true
   auth:
     authenticator: basicauth/grafana_cloud_loki

 logging:
   verbosity: detailed

 prometheus:
   endpoint: "0.0.0.0:8889"
   add_metric_suffixes: false

service:
 telemetry:
   logs:
     level: info
 extensions:
   [health_check, basicauth/grafana_cloud_tempo, basicauth/grafana_cloud_prometheus, basicauth/grafana_cloud_loki]
 pipelines:
   traces:
     receivers: [otlp]
     processors: [batch, tail_sampling]
     exporters: [otlp/grafana_cloud_traces]
   metrics:
     receivers: [ otlp ]
     processors: [
       batch,
       filter/drop_springboot_metrics,
       transform/add_resource_attributes_as_metric_attributes,
       metricstransform/aggregate_http_server_request_duration_labels
     ]
     exporters: [
       prometheusremotewrite/grafana_cloud_metrics,
       prometheus
     ]
   logs:
     receivers: [ otlp ]
     processors: [ batch, resource/loki-labels ]
     exporters: [ loki/grafana_cloud_logs, logging ]
By following these steps, you can effectively reduce the telemetry data produced by your application, staying within the limits of Grafana Cloud's free plan while maintaining essential observability.
Summary
This article outlines various methods to reduce the amount of telemetry data produced by your application, focusing on essential metrics, eliminating unnecessary labels, customizing histogram views, and reducing the number of traces. By implementing these strategies, you can optimize your telemetry data and make efficient use of Grafana Cloud's resources without incurring additional costs.
These practices are confirmed by multiple reliable sources from Grafana’s own documentation and related expert articles.